Building a PowerApp that uses Excel as a database
Click the image above to watch how the PowerApp updates Excel
For 100 days, I will be doing 100 push-ups a day. I built a PowerApp to track the push-ups I have done each day.
The PowerApp does the following:
- Lookup a row from Excel containing today’s count
- Calculate and display the remaining push-ups for today. Each day starts at 100.
- Show a set of buttons for the number of push-ups completed.
- When a button is pressed, update the Excel spreadsheet and show the remaining count. This will be covered in a future blog post
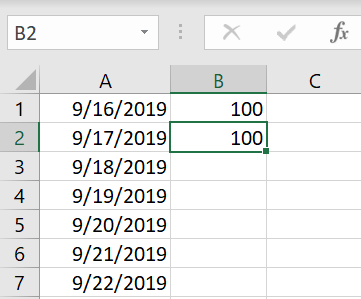
To get this project started, I needed my data in Excel. Starting with a blank worksheet, our data starts off like this.
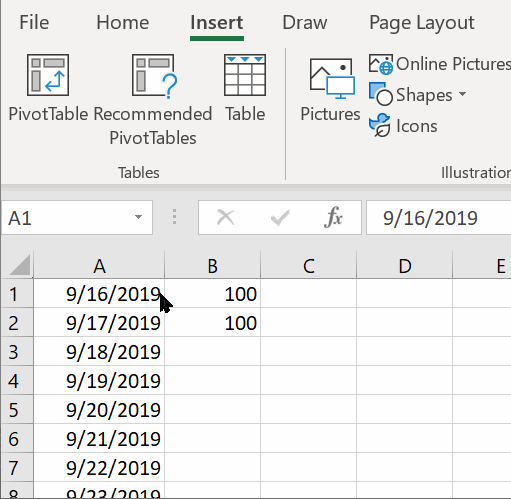
Before you can connect an Excel file you will need to convert the data into a table. To do this, select cells that contain your data then use Insert > Table with the selected values to convert your data into a table.
Once your table is created, assign the Table Name and rename each of the Column Names to describe the data they contain.
I used the following for my table:
- Table Name: pushupTable
- Column1: Date
- Column2: done
Click the image to watch how this is done
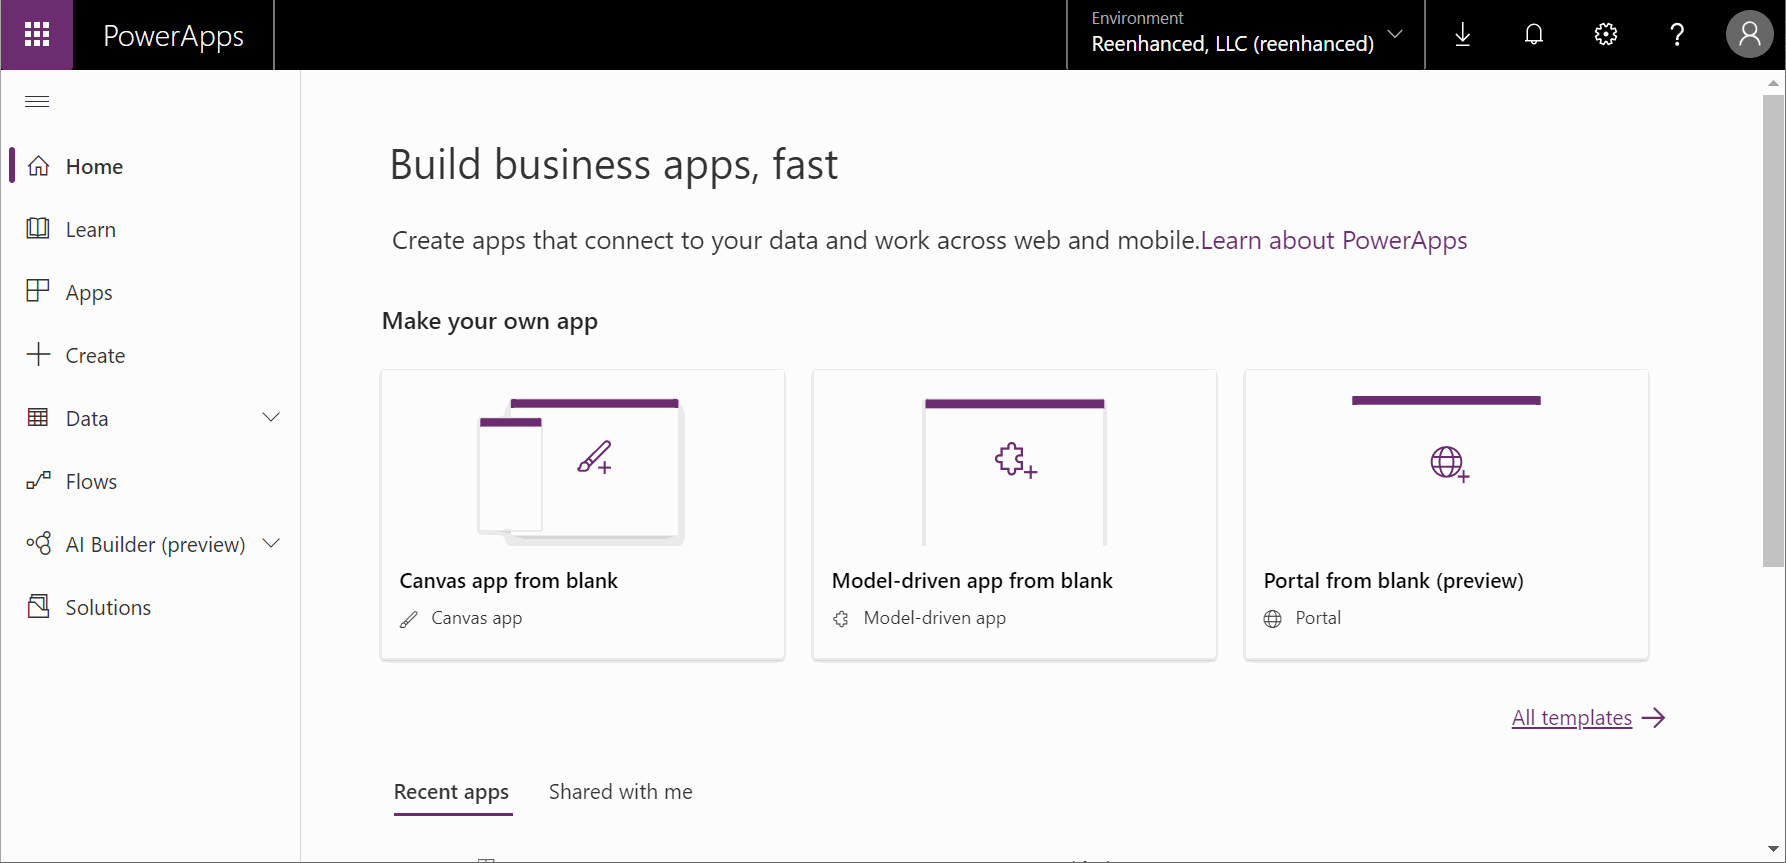
Next, we’ll visit https://make.powerapps.com/ to create a new PowerApp. We’re going to be creating a Canvas App for this project.
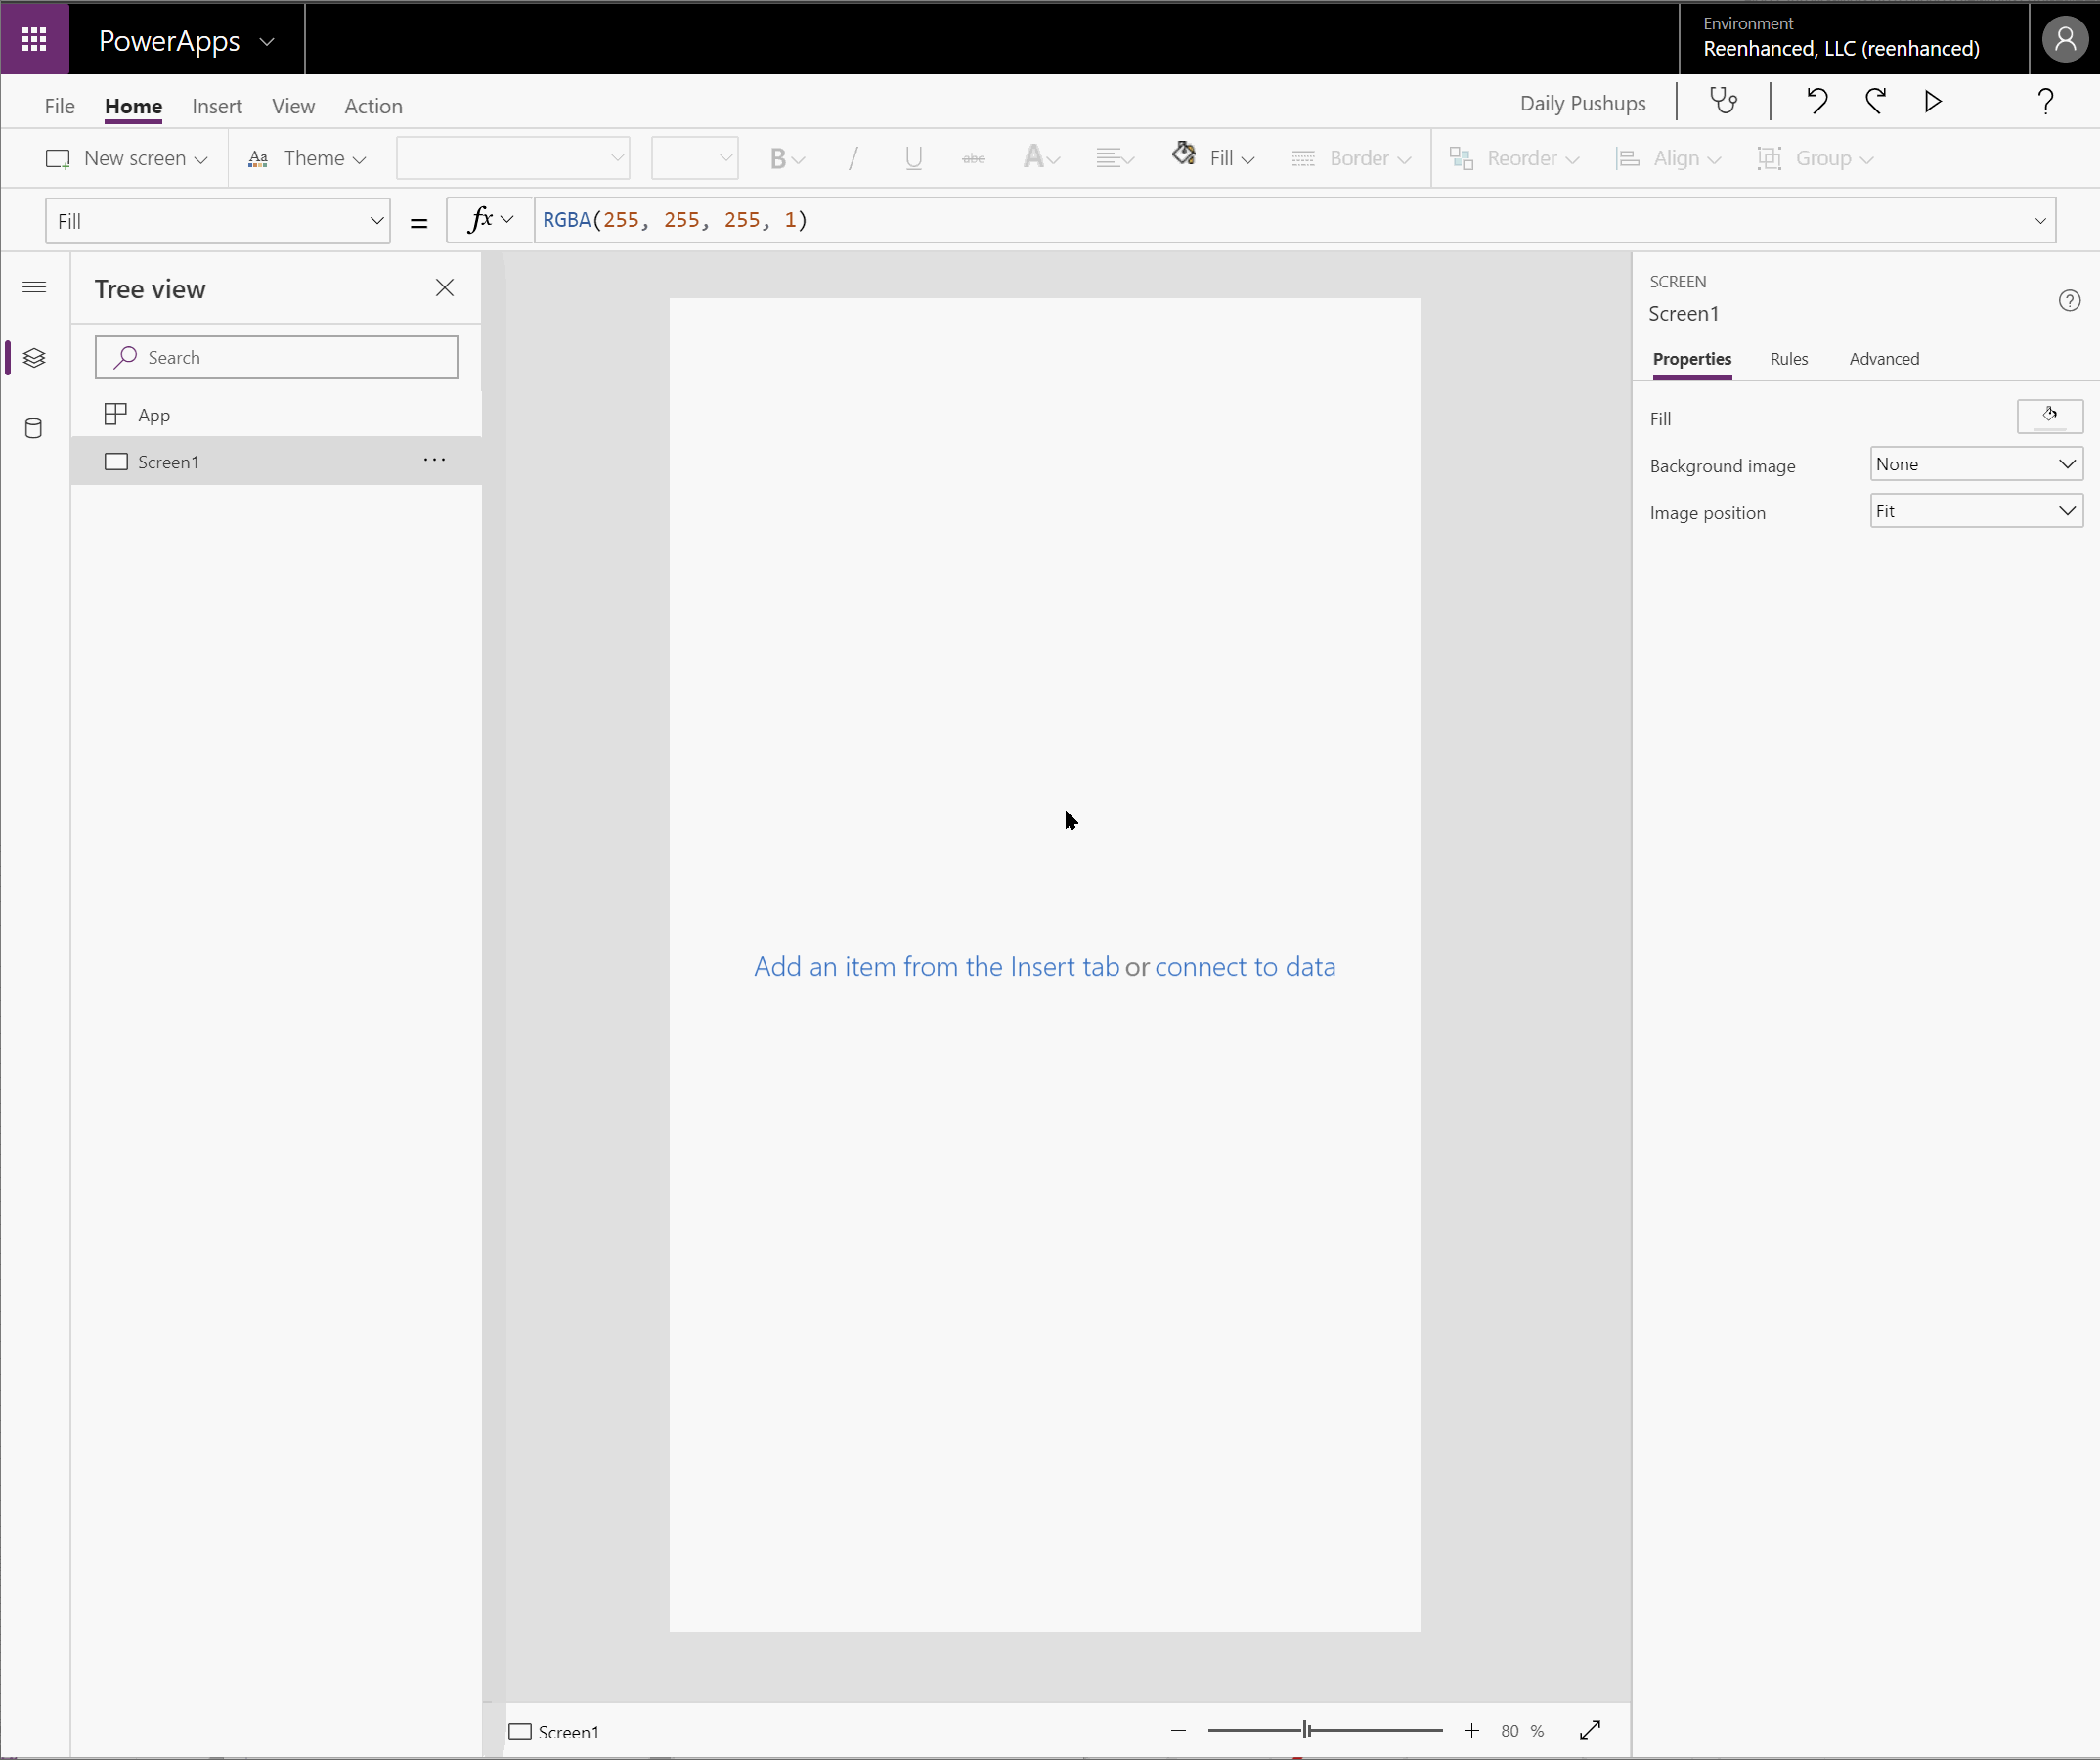
Create a blank canvas app (click to view)
This will give us a completely blank screen. You can use the Insert tab to add various items and place them.
Insert items into the canvas (Click to view)
To build the push-up tracker, we added the following fields:
- Count label
- “Remaining push-ups” label
- 1 button
- 5 button
- 10 button
- 20 button
- 25 button
- 50 button
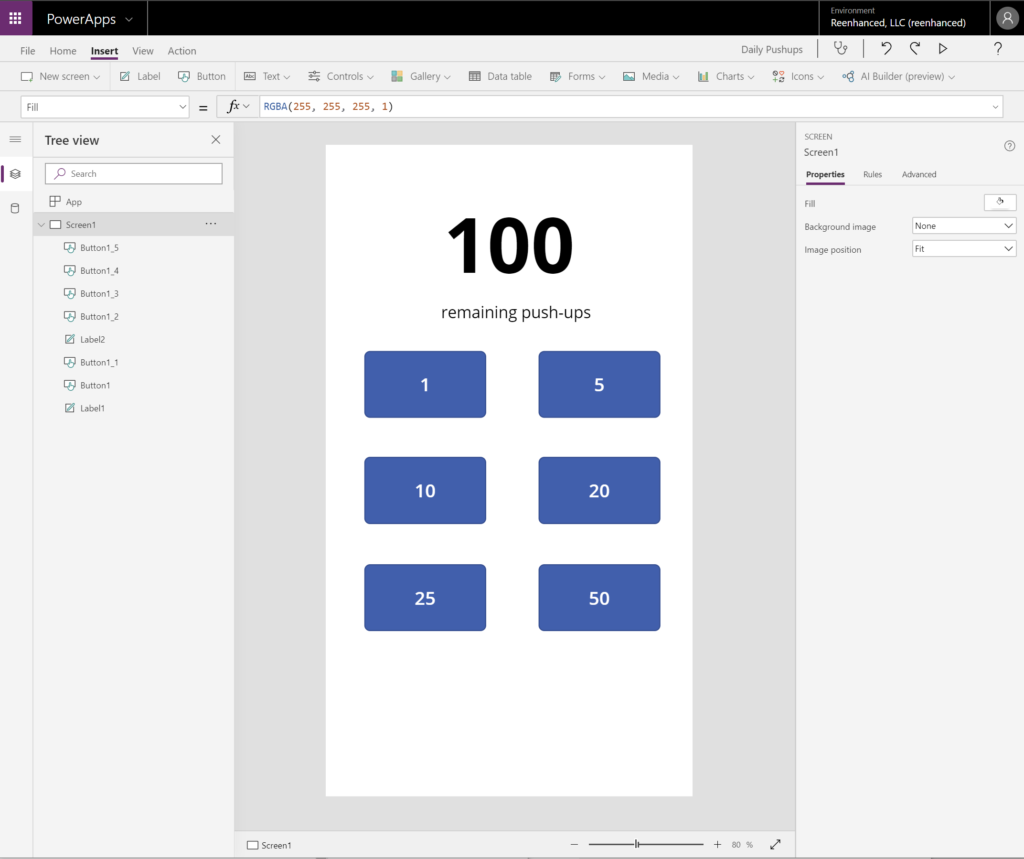
With the layout completed, it’s helpful to give each field a meaningful name. You can double click the field name on the Tree view to rename each. You’ll access these within the coding portion of PowerApps so give each a name that will make sense if you have to maintain this later. You can also choose a color theme under the Home tab.
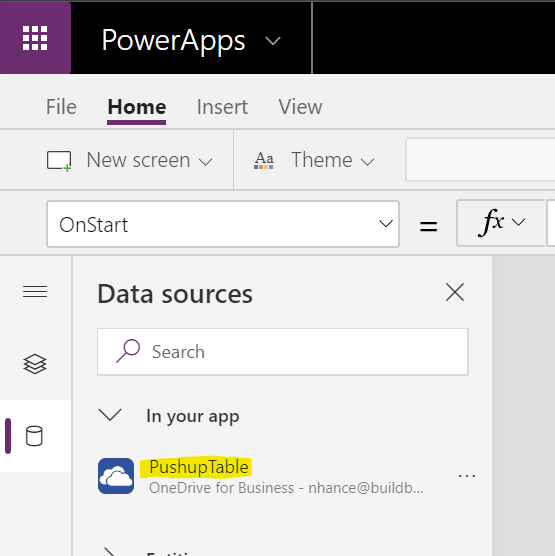
Next, we’ll move on to connecting this to Excel. First, you need to connect OneDrive for Business and select the Excel file and table that you want to use.
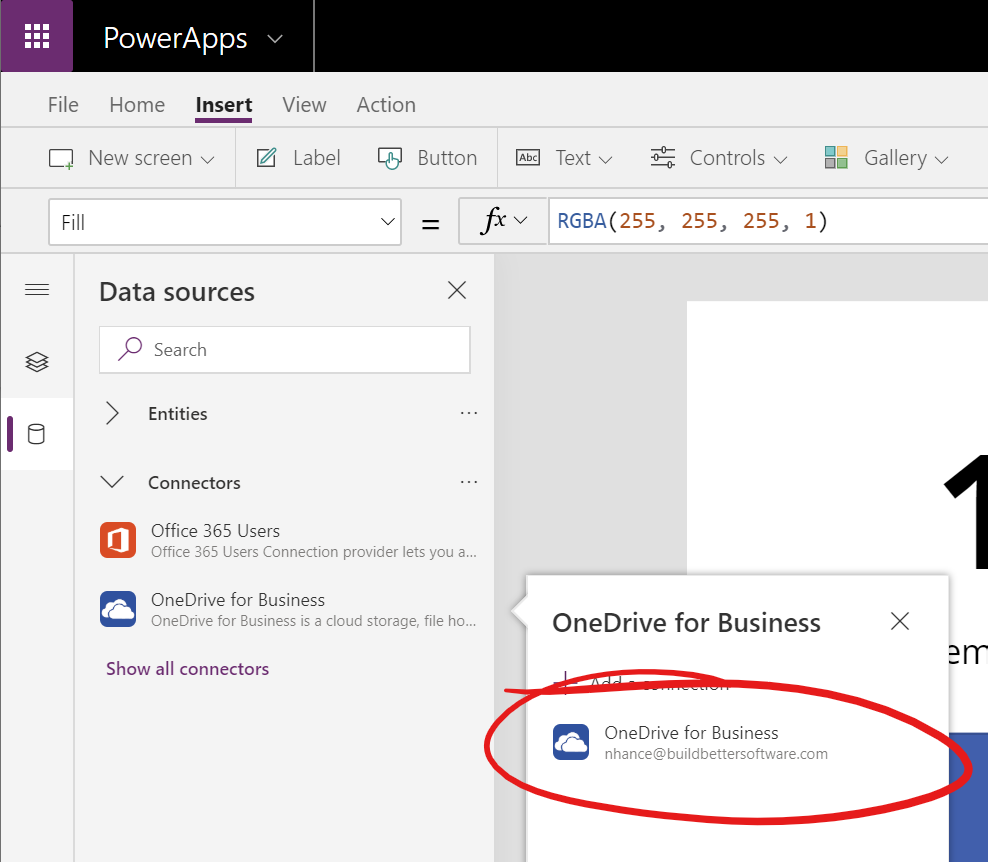
Once your table appears as a data source, your excel file is now connected.
Let’s look at our first requirement for our app: Lookup a row from Excel containing today's push-up count
Breaking this requirement down into steps, we need:
- Access data from our connected data source
pushupTable(The Excel table) - Locate a single row matching today’s
Date - Find the value in the
donecolumn inside the matching row
In order to find a row in our Excel table we use the LookUp function. Here’s the code we’re using:
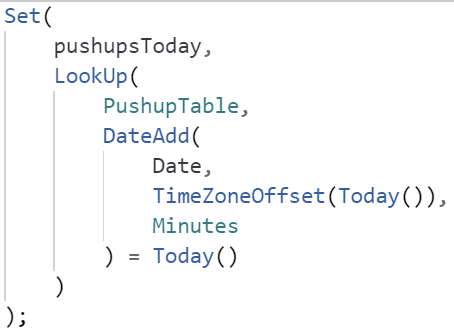
This code looks up a Record from the table PushupTable and assigns it to the global variable pushupsToday.
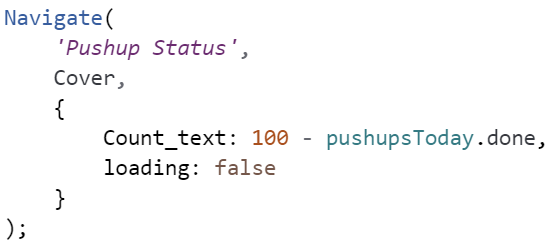
After we have the record stored in pushupsToday we use this to populate a local variable that we will assign inside our Pushup Status screen. To do this, we assign a Context parameter inside of a call to the Navigate function. Note that the call to Navigate isn’t required but is used here so we can push the variable into the right area. It’s not possible to create local variables from within App.OnStart any other way.
Here is the full code we’ve used in our App.OnStart:
Set(
    pushupsToday,
    LookUp(
        PushupTable,
        DateAdd(
            Date,
            TimeZoneOffset(Today()),
            Minutes
        ) = Today()
    )
);
Navigate(
    'Pushup Status',
    ScreenTransition.Cover,
    {
        Count_text: 100 - pushupsToday.done,
        loading: false
    }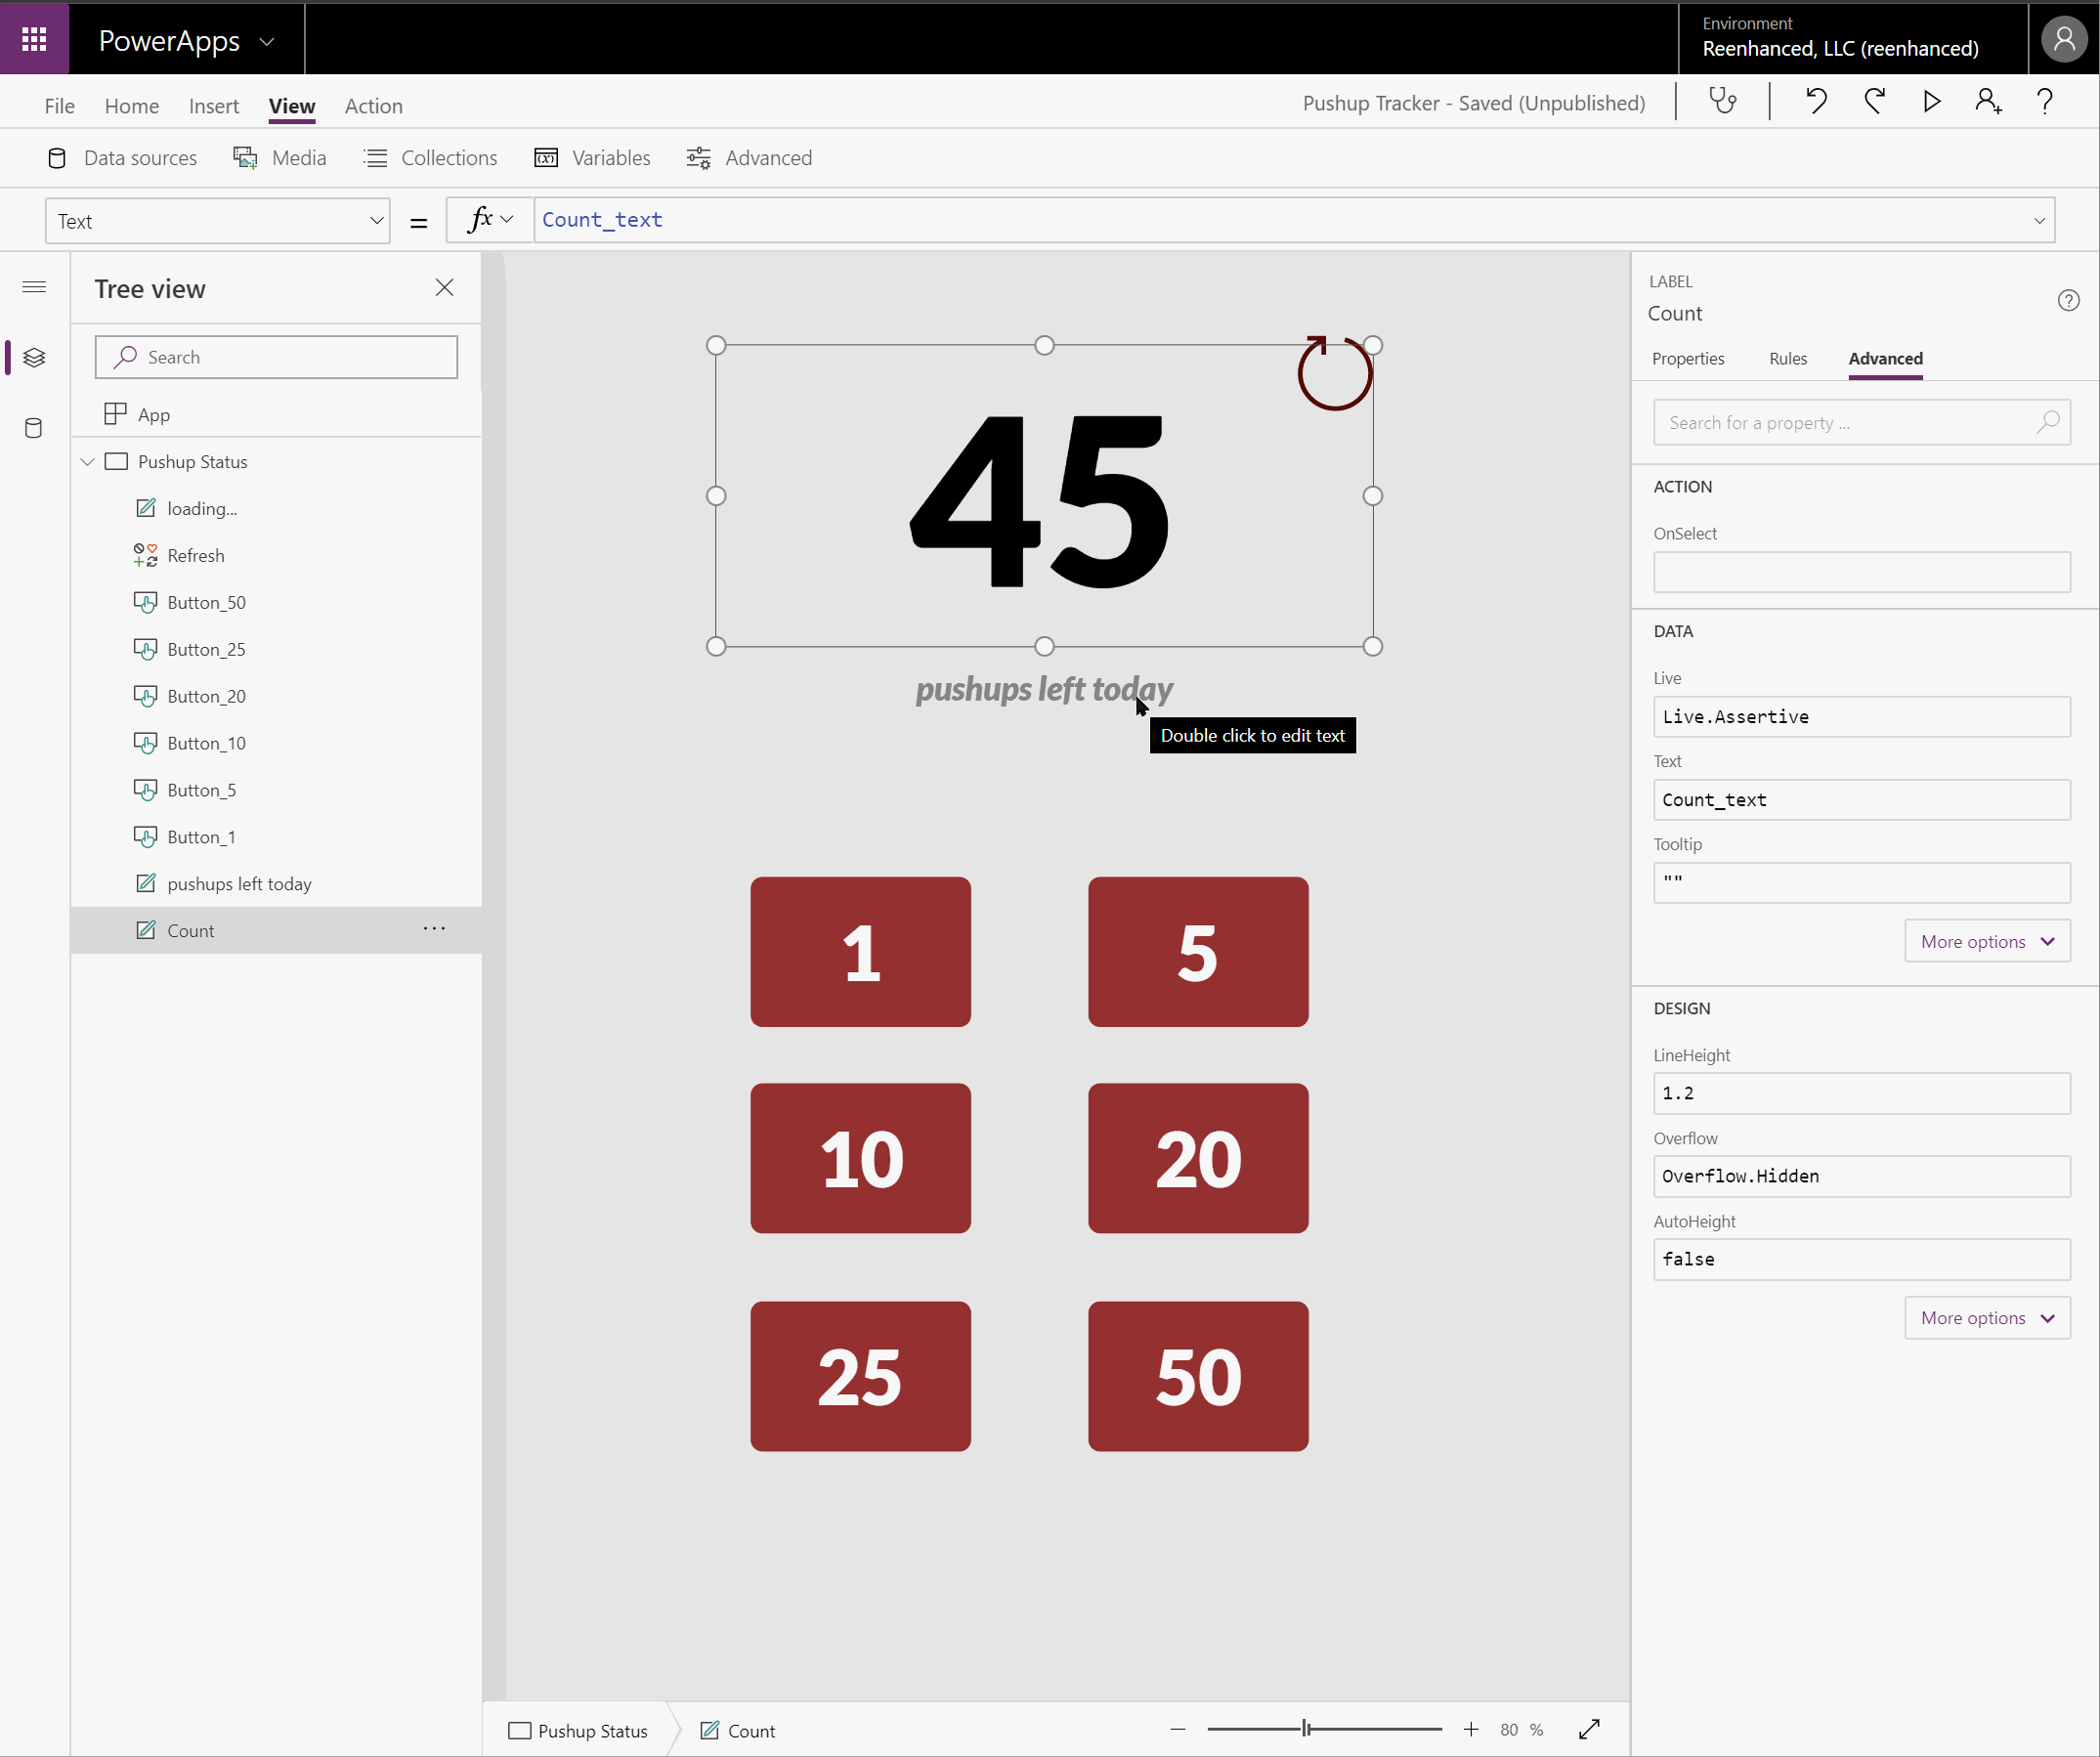
);We’ve assigned a local variable called Count_text with the text that we want to display on the big label. To assign the label to show the value for this, do the following:

Assigning the remaining push-ups to display (Click to watch)
Why are we using a variable to hold the text?
When we assign Count.Text to a variable it will update whenever the value of that variable is updated. In a future blog post you’ll see how we use this to always display the most recent data from Excel so that our push-up count is always accurate.
The first step in our PowerApp is now done. We are showing the remaining number of push-ups for the current day on top of the app. In coming blog posts we will cover how to enable each of the buttons and how we’ll use what we did today to dynamically update the remaining count so it is always accurate.
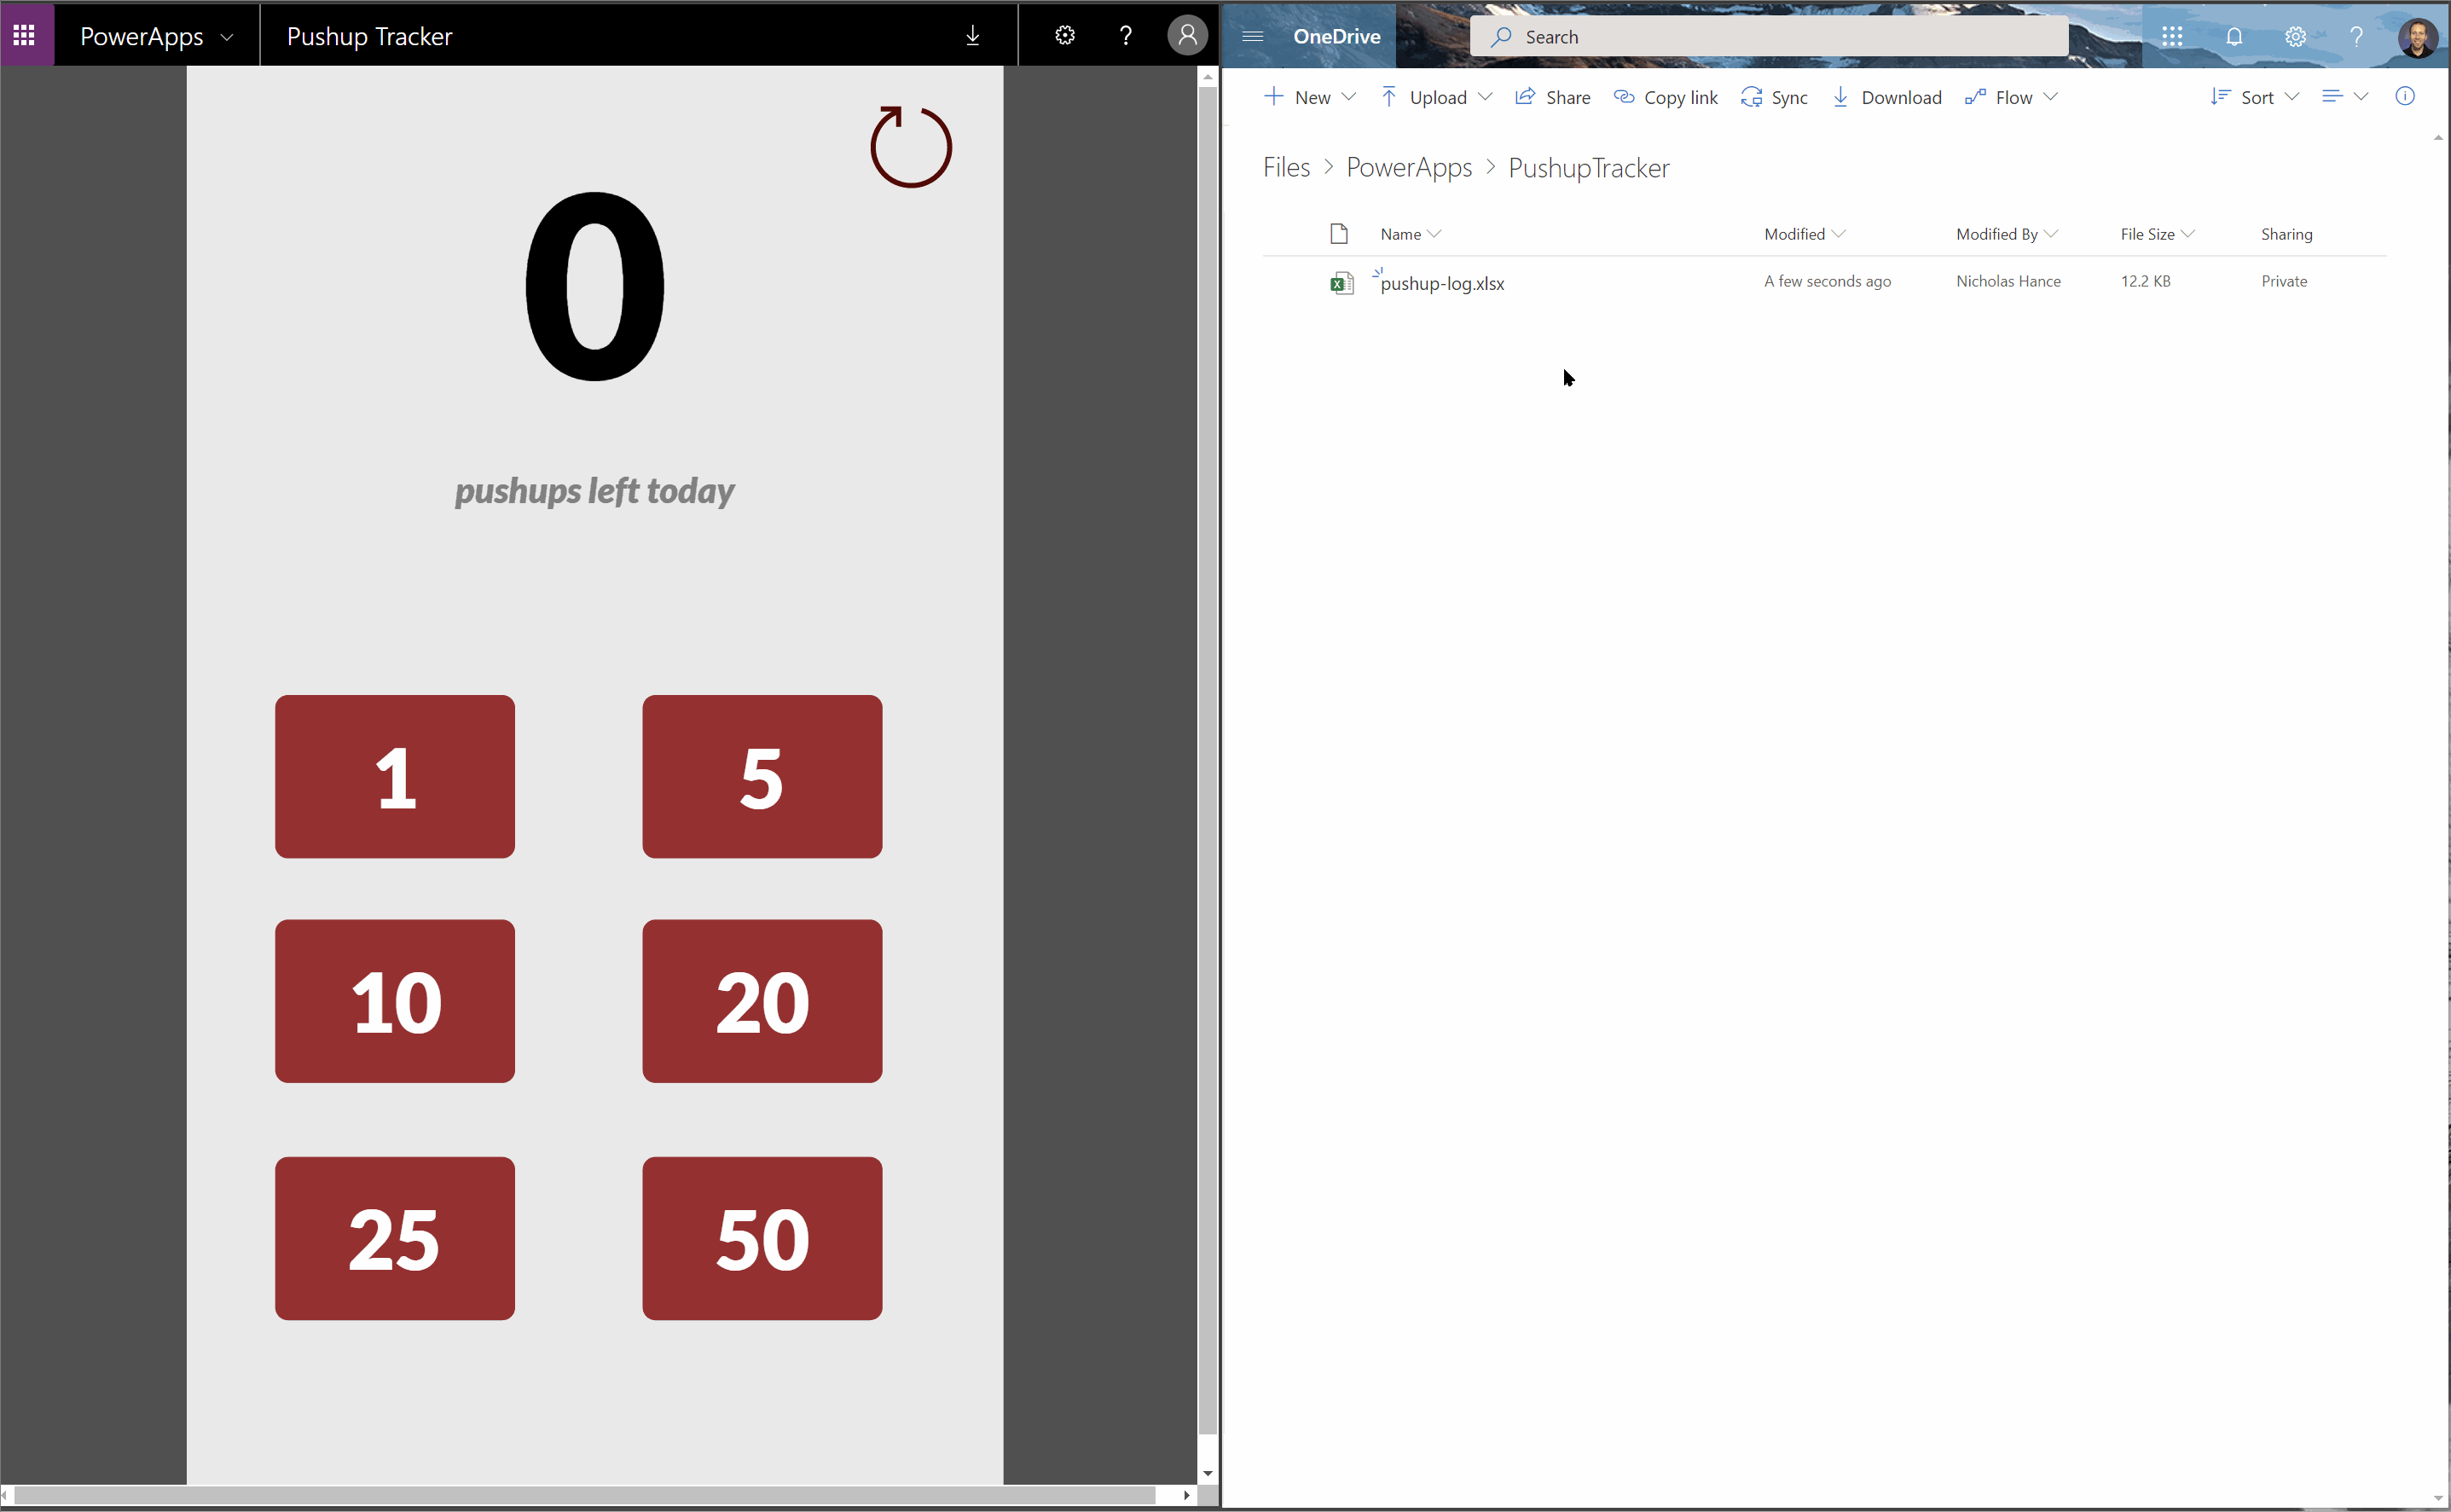
As a final walkthrough, lets run our app and show how all of the moving pieces are connected. View the image below to see how the values are captured from Excel and then used to display inside the app.